alon.wtf
see the internet, rendered strange
This is who's winning AI
right now.
The internet's top AI creators are fighting a live king-of-the-hill war for the crown. 👑 Supermicro_SMCI holds it — for now.
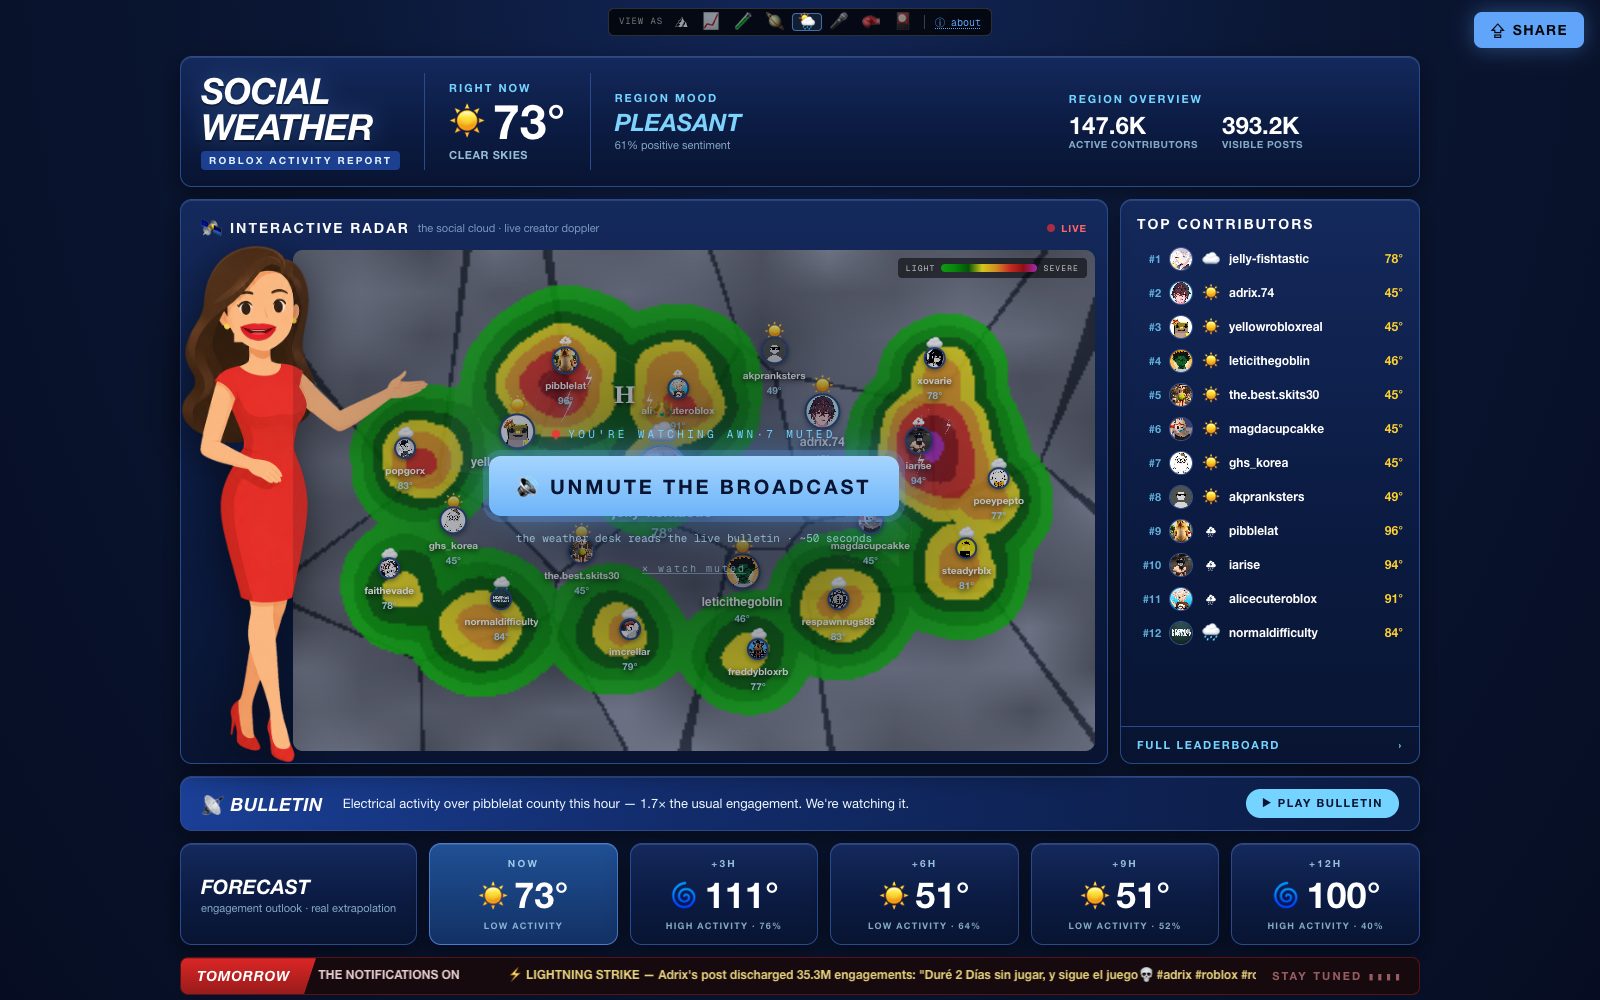
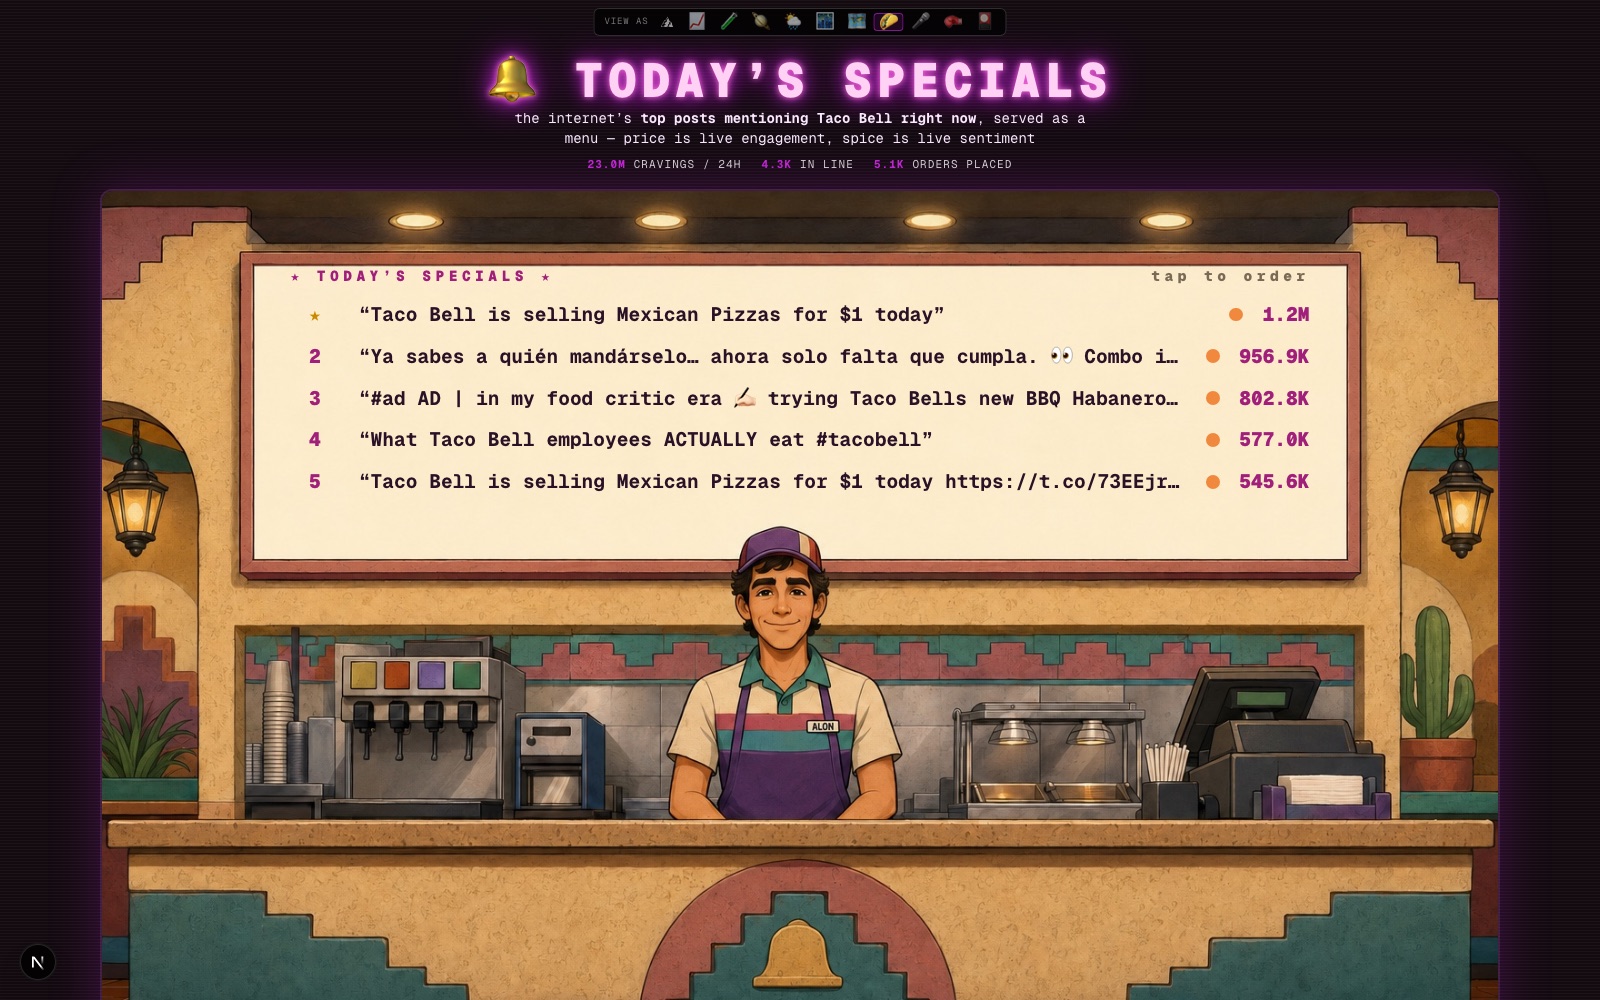
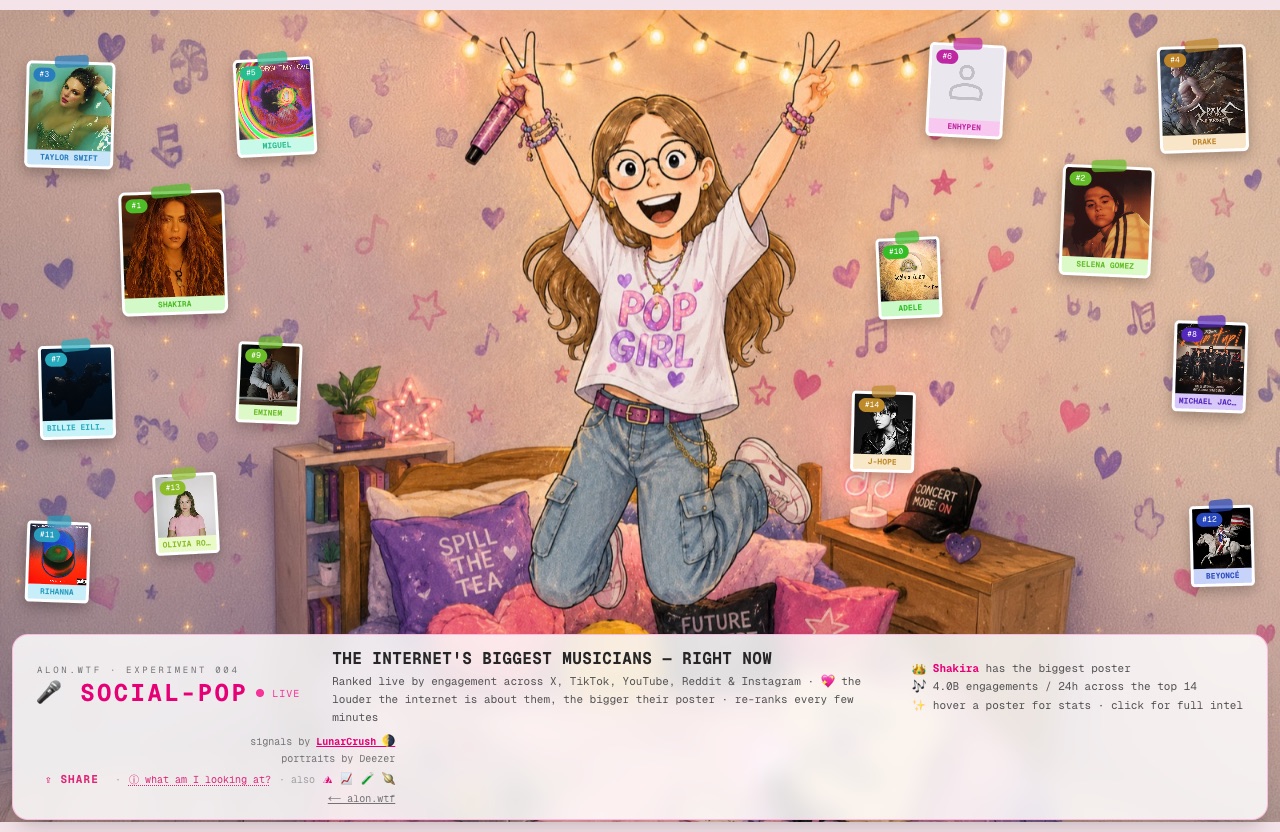
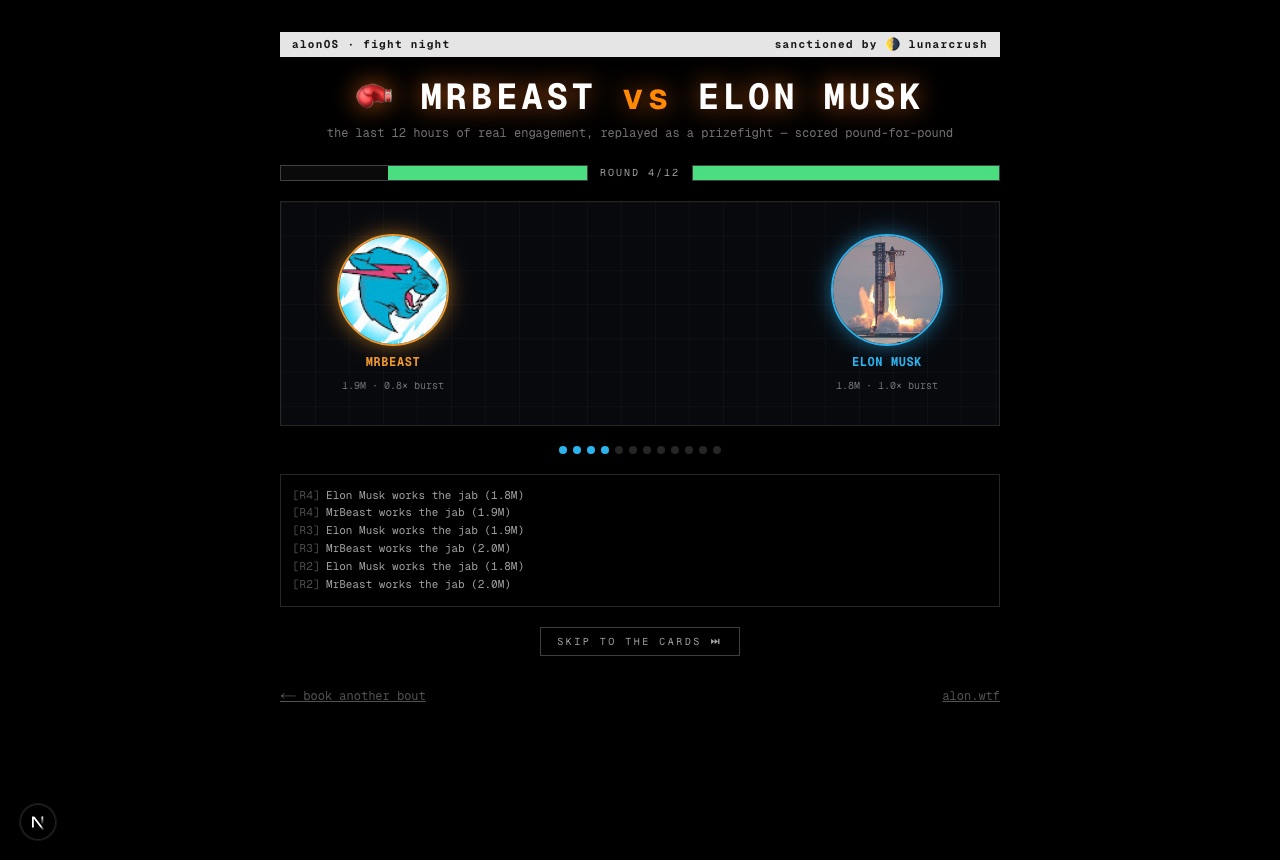
EVERY WAY TO SEE IT · one topic, nine living scenes
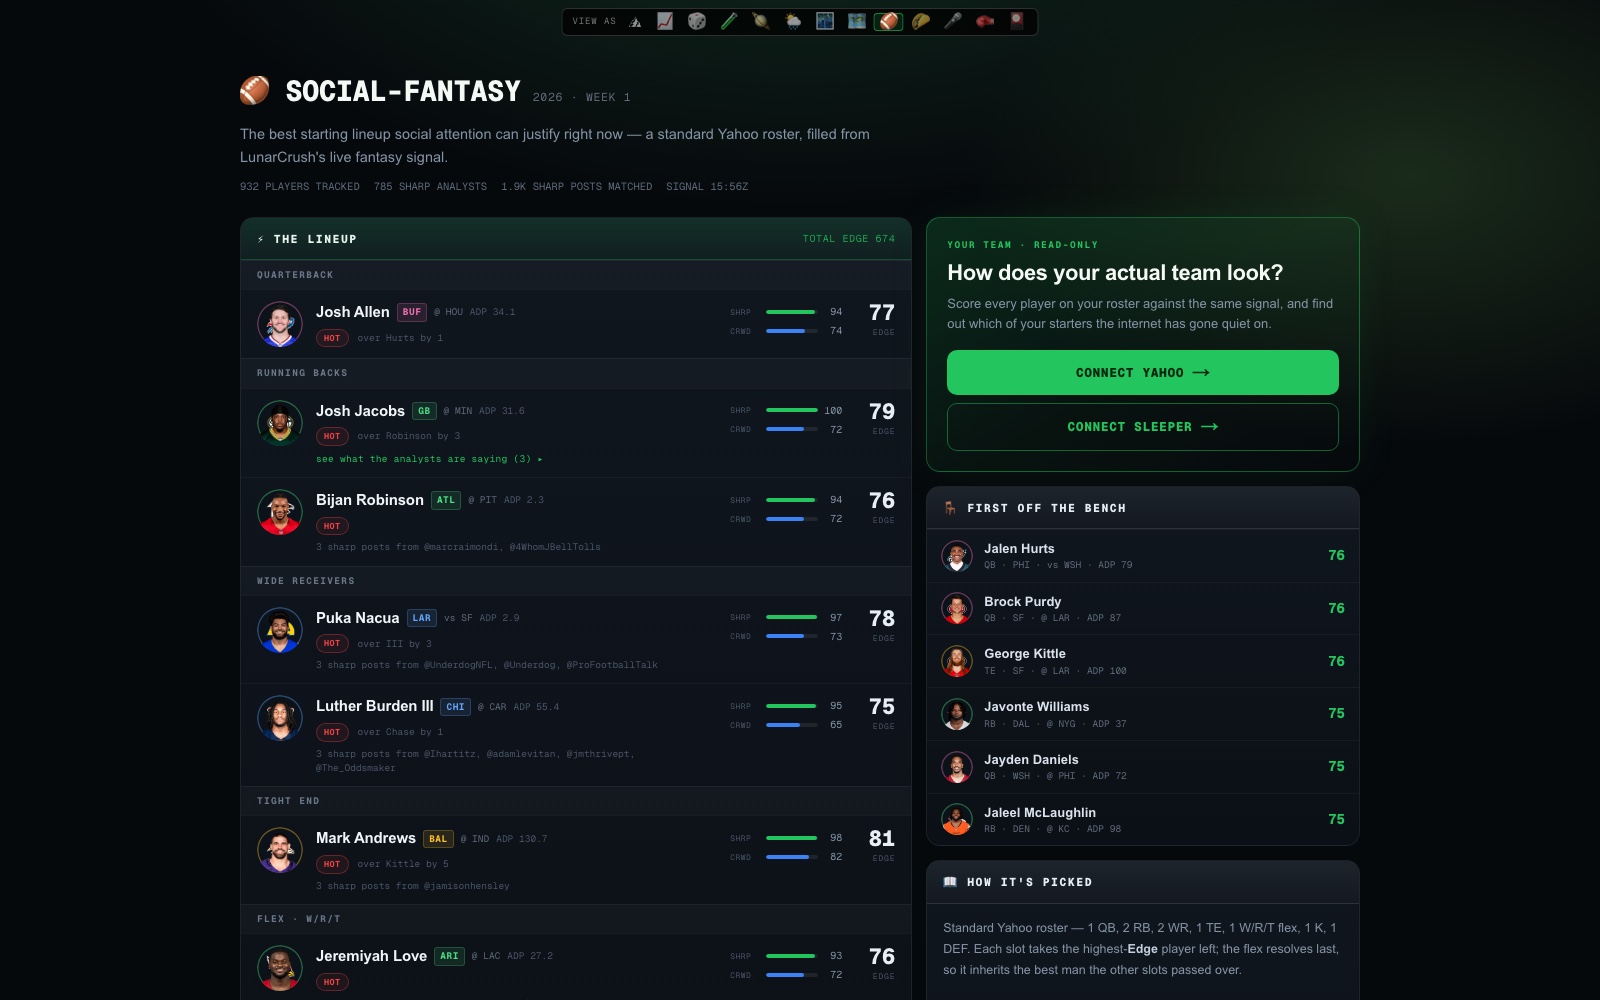
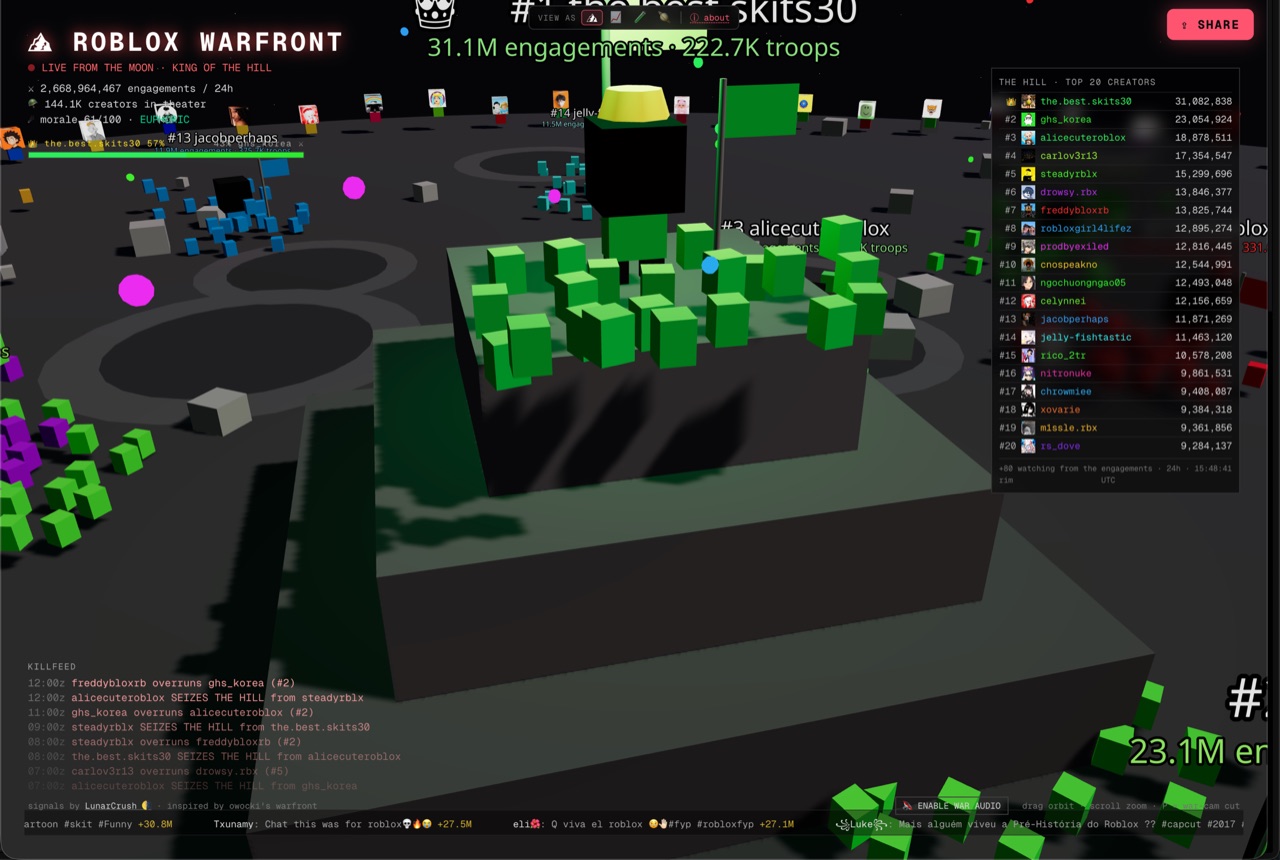
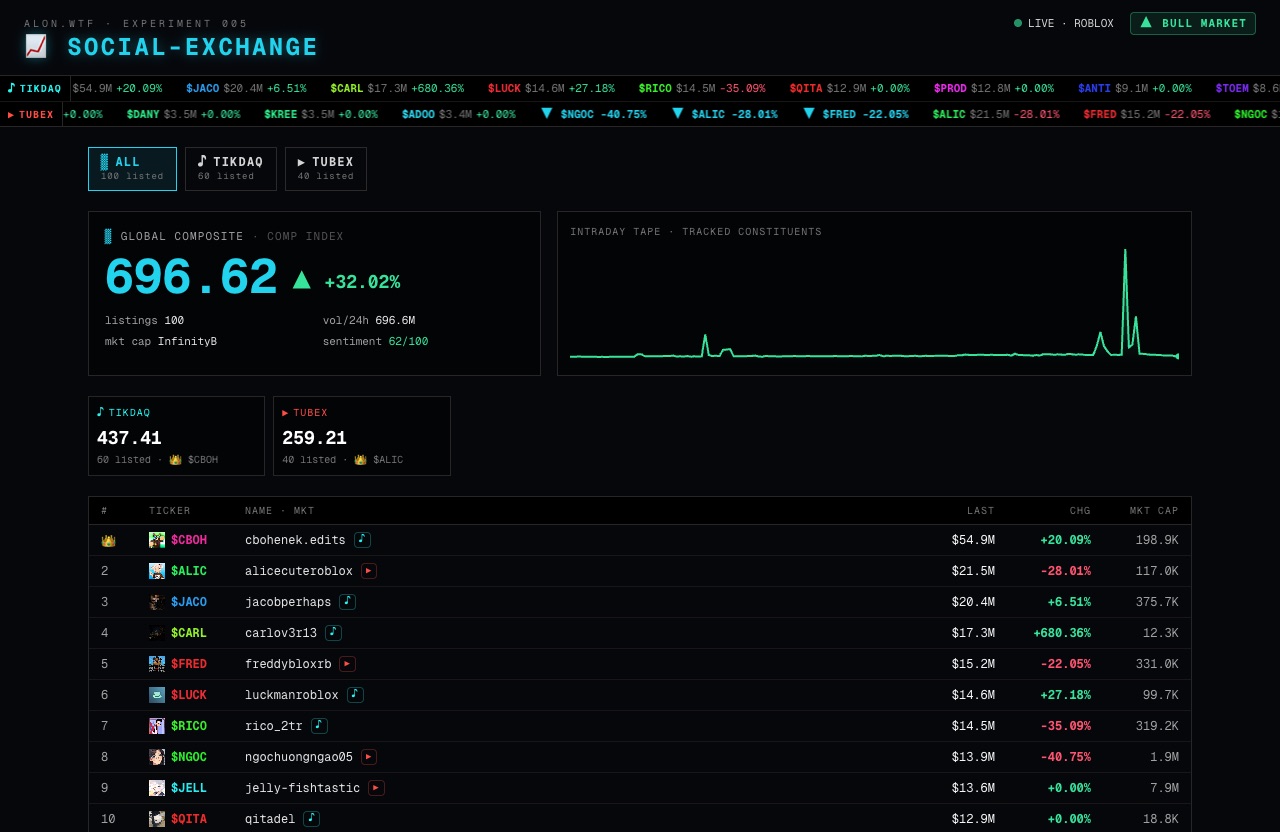
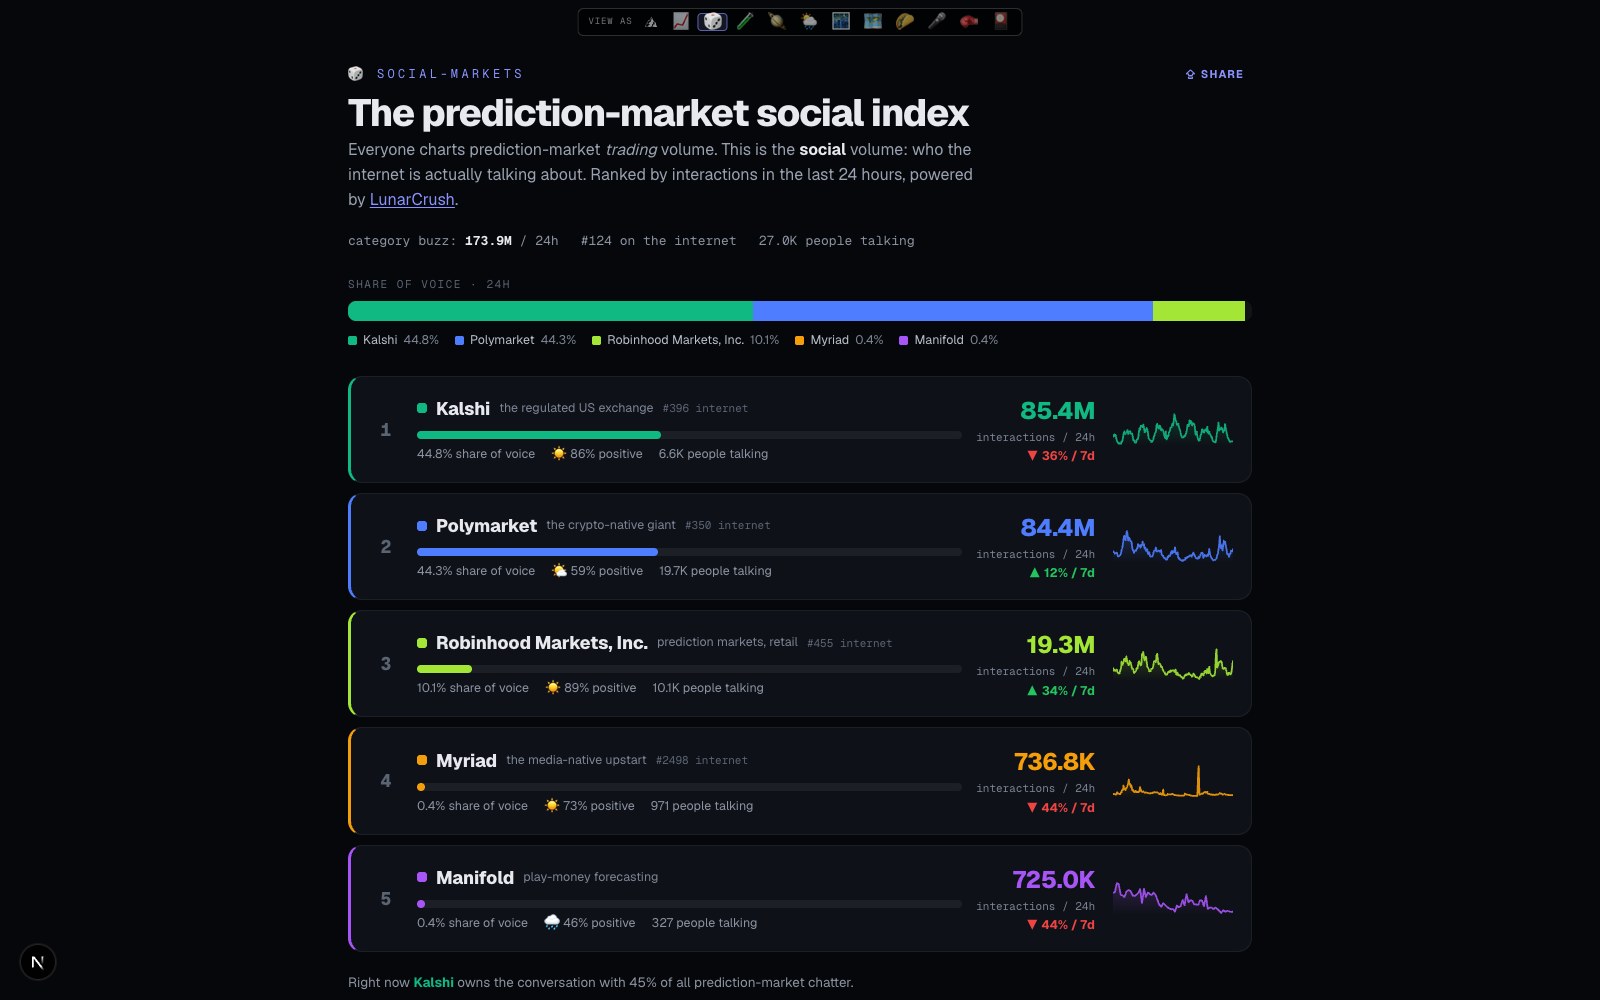
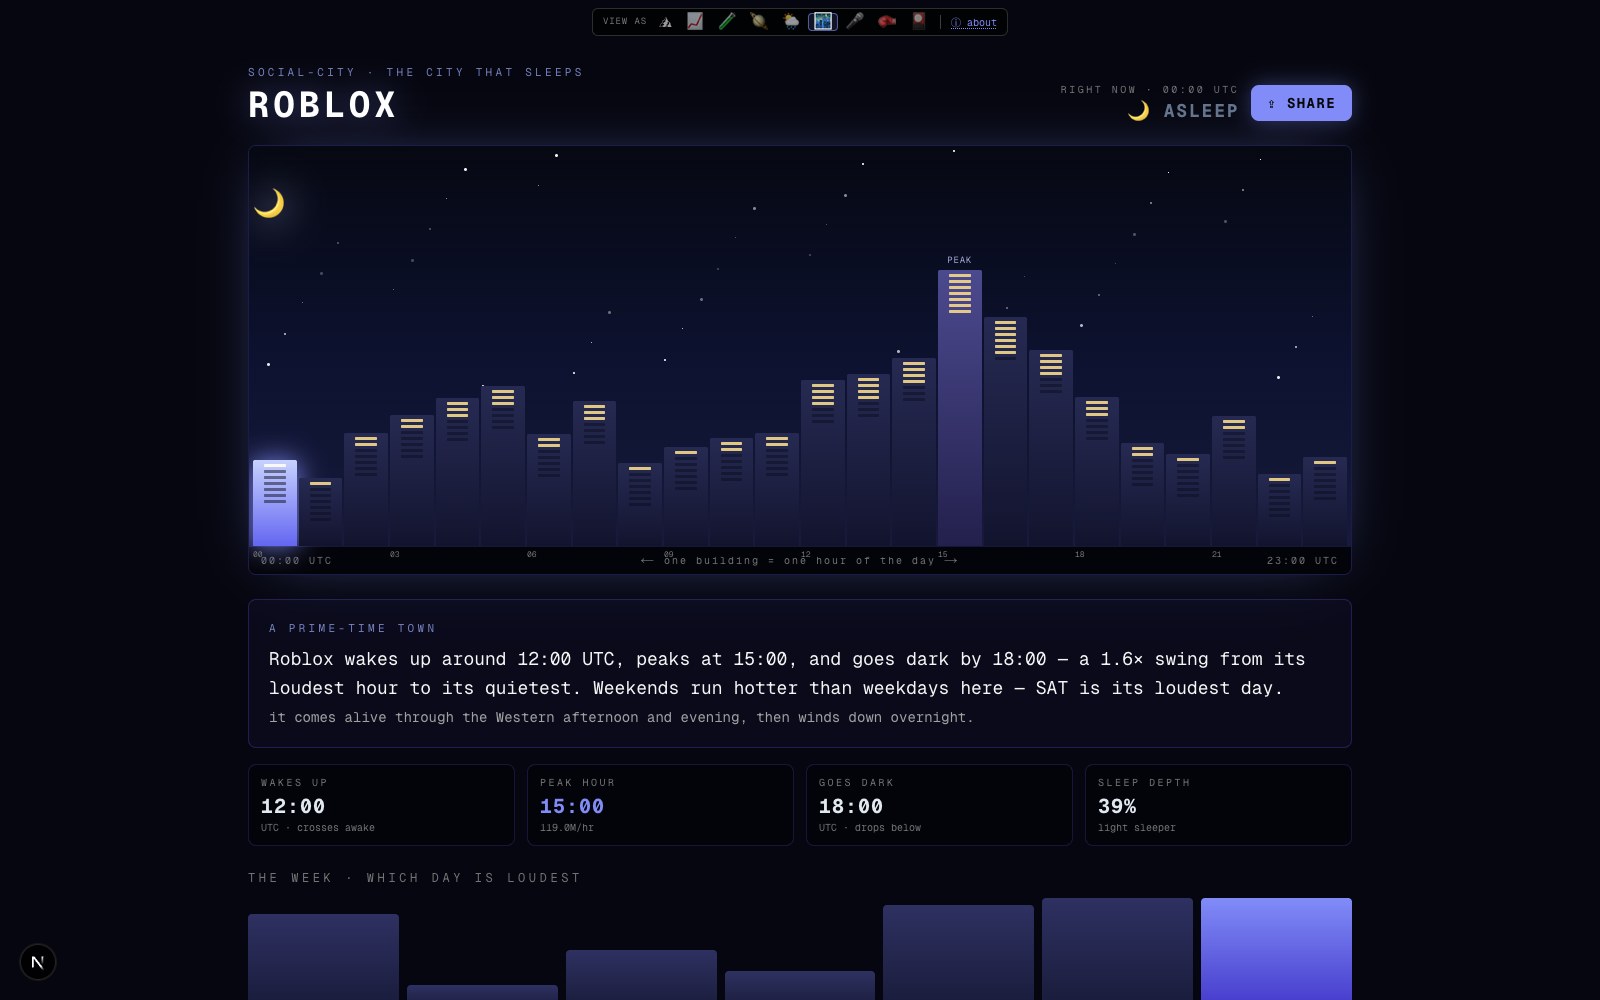
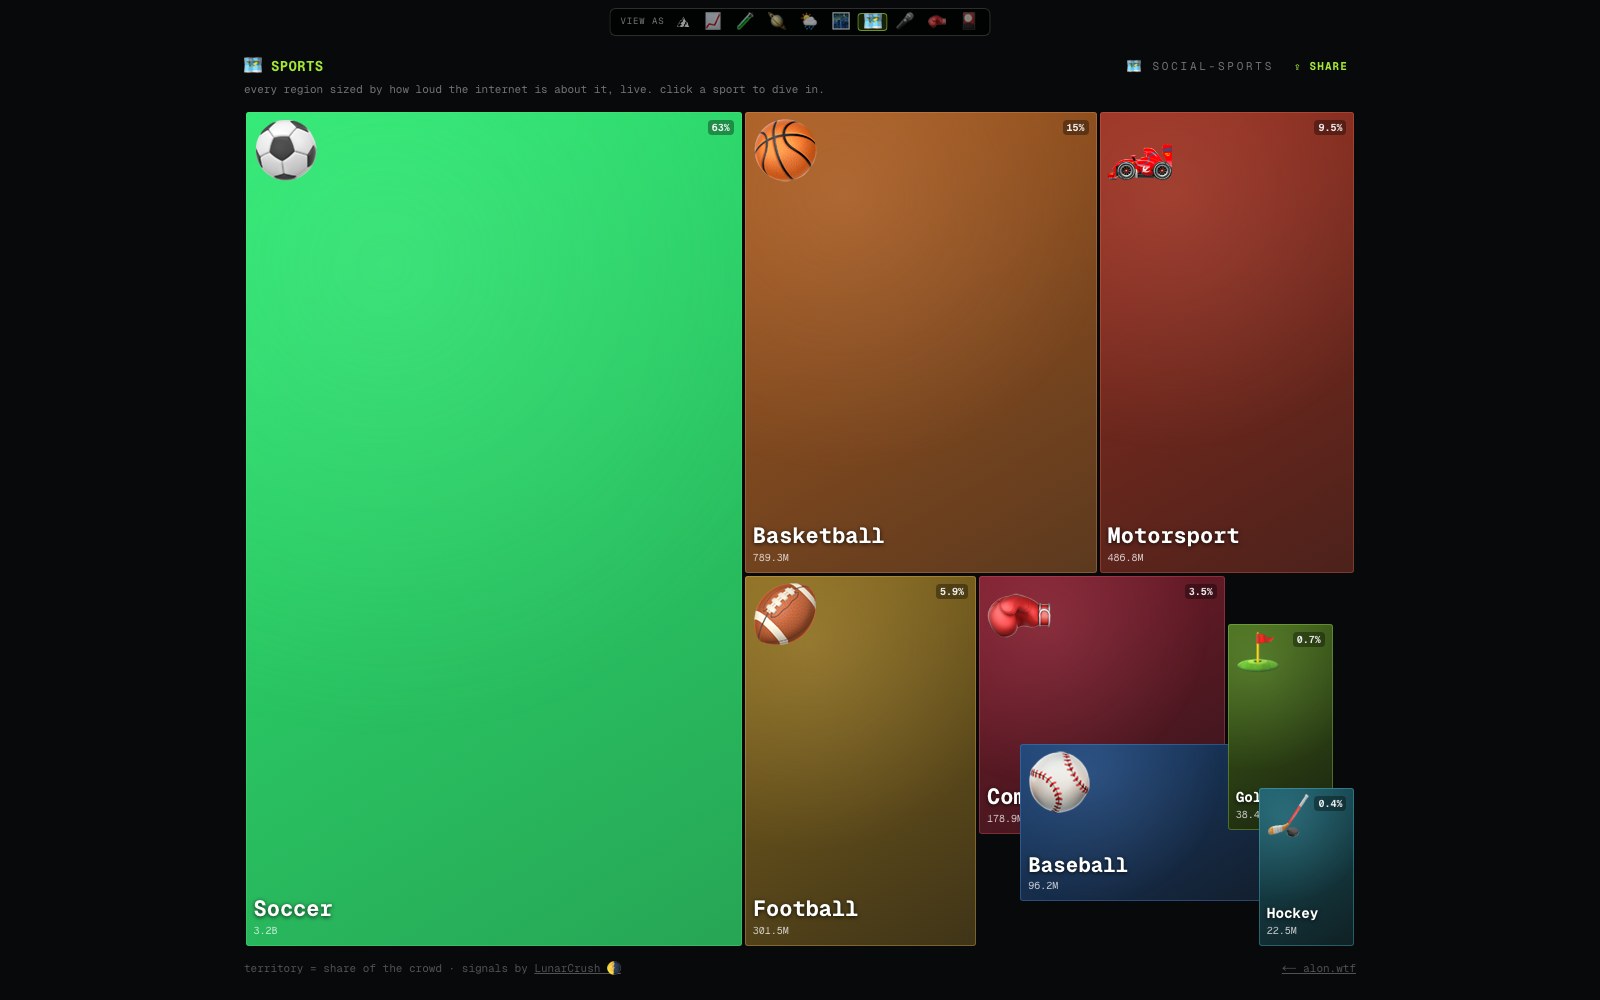
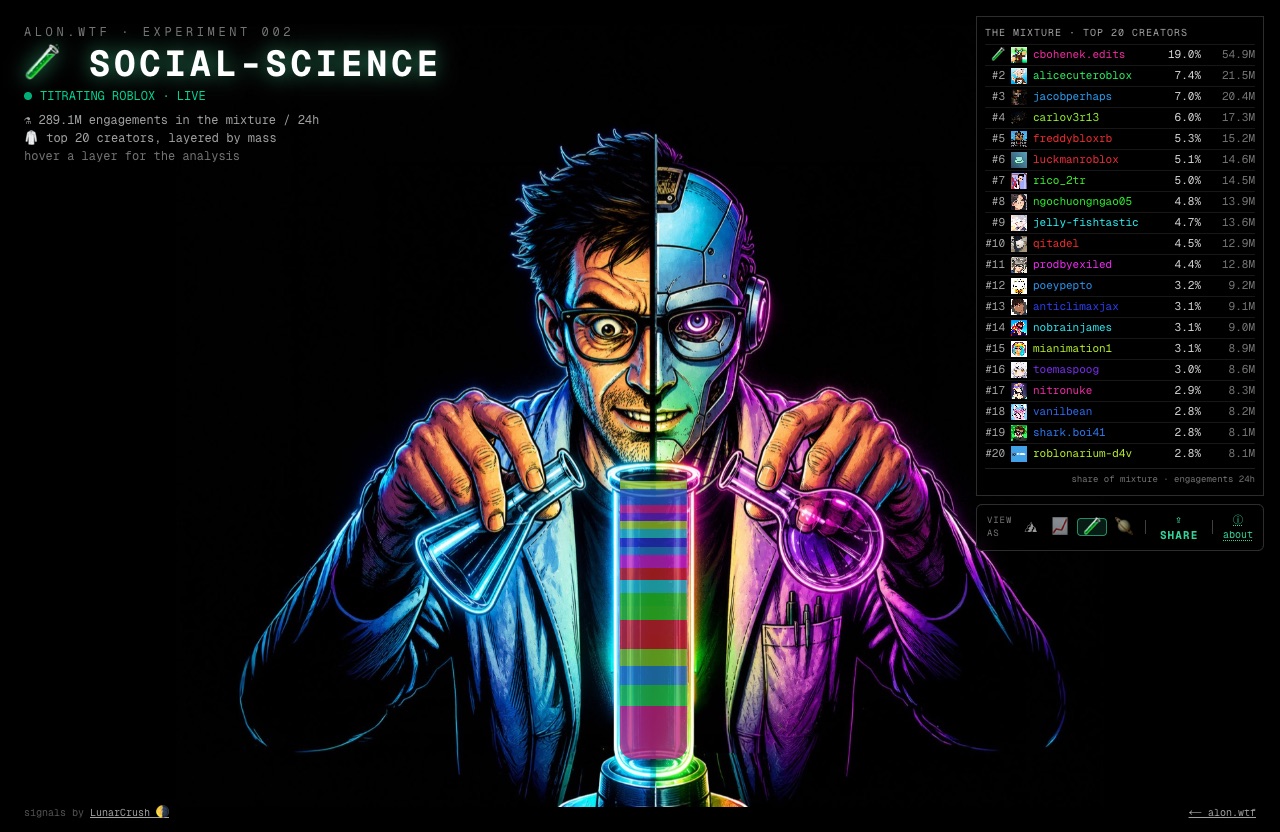
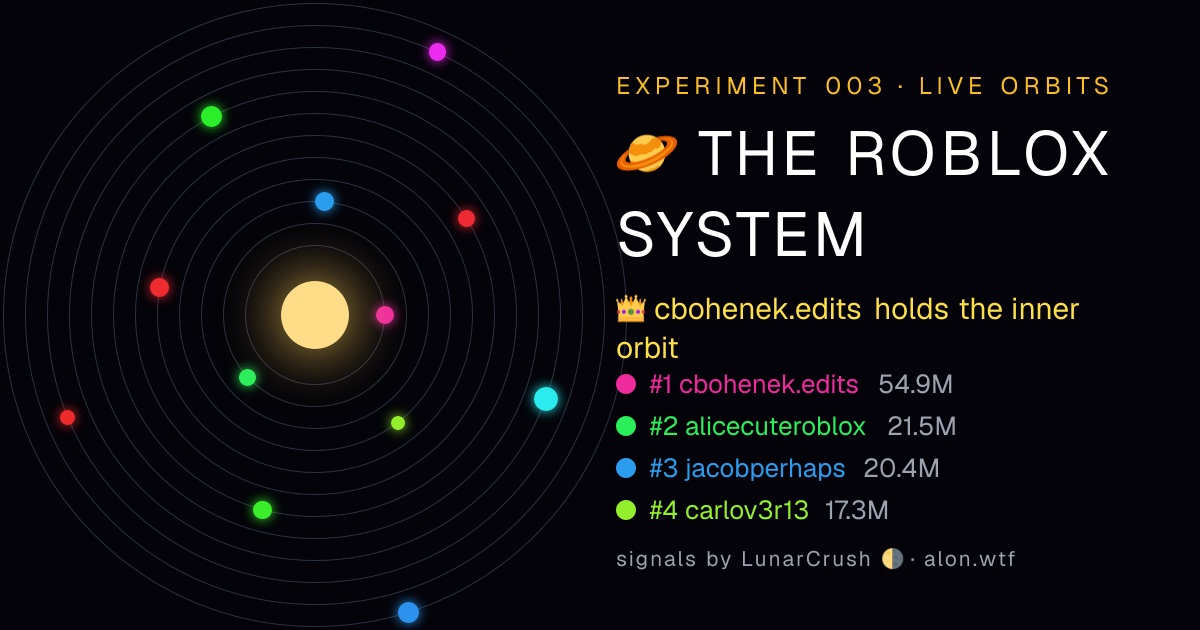
WHAT IS THIS
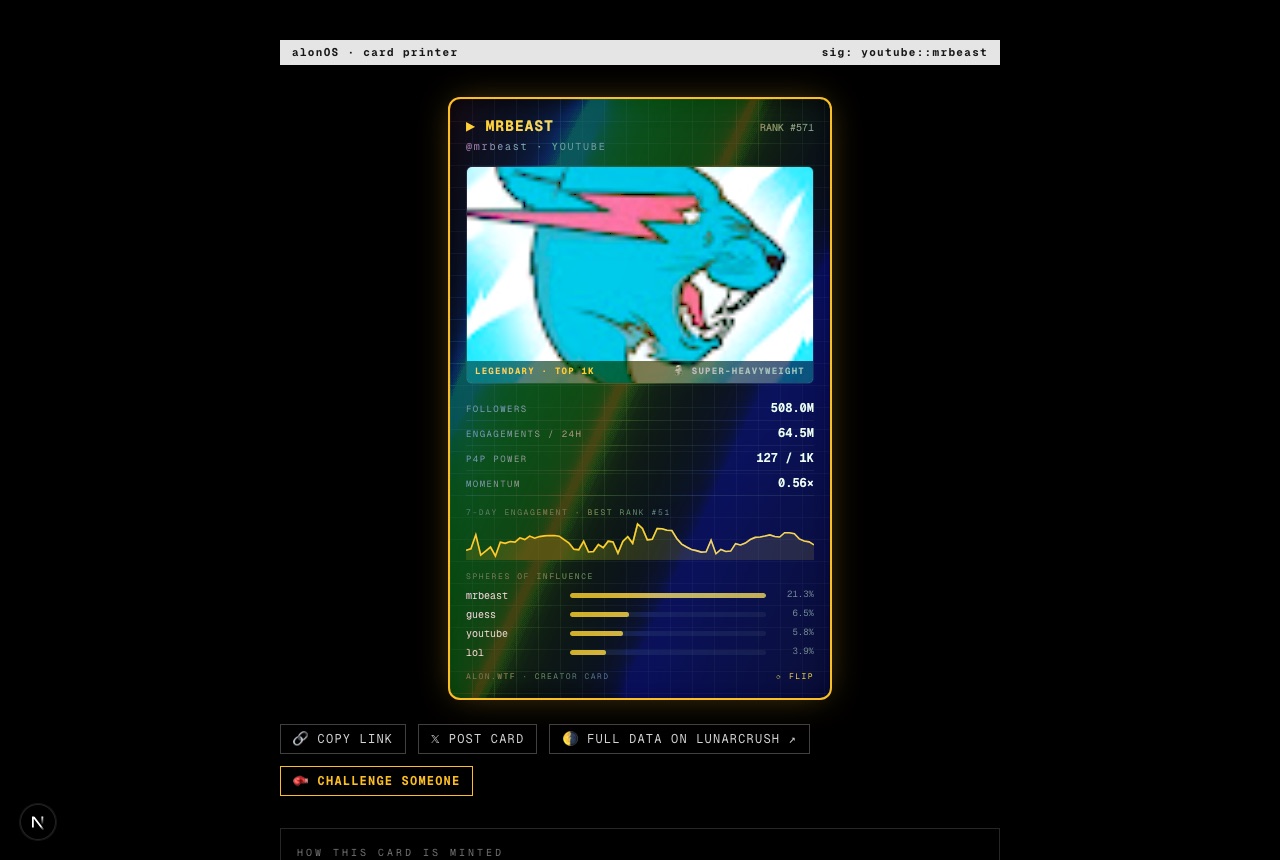
alon.wtf is a growing set of live data-art experiments. The premise is simple: the same real-time social data can tell a completely different story depending on the metaphor you pour it into. So each experiment takes the identical signal — the top creators of a topic, their rank, followers, engagement, momentum and sentiment — and stages it as a different living scene.
Nothing here is a static chart. Rankings shift, viral posts land, and leaders get dethroned in real time, exactly as they do across the social internet. Pick any topic and watch the same leaderboard become a battlefield, a trading floor, a city that sleeps or a solar system.
HOW IT WORKS
- 1 · Type a topic.A game, a coin, an artist, a brand — anything the social internet talks about. Or tap one that's trending.
- 2 · We pull the signal. LunarCrush provides the live leaderboard: rank, followers, engagement, sentiment and top posts across every major platform.
- 3 · The scene comes alive. Each experiment maps that signal onto its own physics and re-ranks itself about once a minute.
FAQ
- What is alon.wtf?
- alon.wtf turns real-time social data into strange, living scenes. Type any topic and it takes the internet's top creators for it and renders them through a different metaphor — a war, a stock market, a city that sleeps, a solar system, a chemistry lab.
- Where does the data come from?
- Every social signal — creator rankings, follower counts, engagement, sentiment and top posts — comes from LunarCrush. Each scene polls live and re-ranks itself while you watch, so the crown genuinely changes hands in real time.
- How often does it update?
- Scenes refresh about once a minute. Rankings and engagement reflect the last 24 hours of activity aggregated across X, TikTok, YouTube, Reddit, Instagram and news.
- Can I visualize any topic?
- Yes. Type any topic on the homepage — a game, a coin, an artist, a brand, a meme — and if the internet is talking about it, you can open it in the war, exchange, city, science and system scenes. Or go straight to a URL like /exchange/bitcoin or /war/minecraft.
- Who makes this?
- alon.wtf is built by alon as an ongoing series of “strange & rad” experiments in visualizing real-time social data.